Zimbabwe 2023 Macroeconomic Analysis

I created this project in the run-up to Zimbabwe’s August 2023 elections. I wanted to offer a clear, data-driven picture based on official sources. Using datasets from the Reserve Bank of Zimbabwe, the Ministry of Finance and Economic Development, and ZIMSTAT, I explored the country’s economic landscape to better understand the real facts — not opinion.

The result is a comprehensive analysis that covers inflation, currency volatility, trade balances, and key fiscal and monetary policy indicators. The dashboard uses interactive visuals to provide deeper insight into how the Zimbabwean economy performed during this critical year.

Project Highlights

  • Sourcing macroeconomic data
  • Visualising economic indicators
  • Prseenting Data Sources
  • Key insights
Data sourcing and methodology visual

Sourcing the Data

The analysis relies on official data from the Zimbabwe Open Data for Africa portal, which consolidates statistics from key institutions including the Zimbabwe National Statistics Agency, the Reserve Bank of Zimbabwe, and the Ministry of Finance & Economic Development.

After downloading the datasets, light cleaning and minor adjustments were performed in Excel before importing the data into Tableau for detailed analysis and visualisation.

Visualising economic indicators dashboard

Visualising Economic Indicators

Given the diversity of the economic datasets, the visualisations and dashboards were organised into five themes for clarity and focused analysis:

GDP: Exploring economic growth trends starting from March 2019, including metrics like GDP, GNI, and related growth indicators.
Trade: Detailing imports, exports, trade balances, and direction of trade to understand Zimbabwe’s international commerce.
Monetary Policy: Tracking key indicators such as inflation, exchange rates, money supply growth, and interest rates.
Labour Force: Analysing employment rates, informal employment, and income distribution patterns.
Fiscal Policy: Reviewing government fiscal surplus, debt ratios, and remittances affecting the economy.

Visualisation of data sources and their coverage periods

Visualising Data Sources

Inspired by the academic practice of referencing, I wanted to communicate the origin and scope of the datasets I used for transparency and recreatability. So I created a dedicated dashboard that maps each data source to the relevant dashboards, metrics, frequency, and date range.

This interactive chart displays the coverage period of each source along a timeline with years on the x-axis, illustrating how many years of data each source provides. It also highlights which metrics belong to which data source and which dashboards use them.

Users can interact with each data point to access the original data source directly, providing transparency and easy verification of the data underpinning the analysis.

Key Insights

This section summarises the main economic findings from the dashboard. It highlights insights across GDP, trade, inflation, employment, remittances, and fiscal policy in the period leading up to and throughout 2023.

GDP Trends

Zimbabwe’s GDP figures were reported in constant US dollars. Between 2019 and 2023, the economy grew at an average annual rate of 1.63%. There were two years of contraction in 2019 and 2020, followed by a recovery in 2021 and 2022. The strongest growth was recorded between 2020 and 2021, reaching 8%.

Trade Balance and Export Partners

During the same period, Zimbabwe recorded a negative trade balance of –$1.87 billion USD, meaning the country imported nearly $2 billion more than it exported. Most of Zimbabwe’s exports went to Sub-Saharan Africa, with South Africa being the top destination. The second largest export destination was Western Asia, specifically the United Arab Emirates. I also included a detailed breakdown of imports and exports by HS code to show which goods were traded.

Inflation and Monetary Policy

Inflation in 2023 was severe. In June, the year-on-year inflation rate stood at 175.75%, while the rate for food and non-alcoholic beverages alone was a staggering 255.6%. Month-on-month inflation for June reached 74.46%, reflecting ongoing price instability.

The five categories with the highest year-on-year inflation in June were:

  1. Communication
  2. Food and non-alcoholic beverages
  3. Housing, water, electricity, gas, and other fuels
  4. Recreation and culture
  5. Transport

Monetary policy data also showed exponential growth in the money supply (M2), pointing to increased liquidity in the economy and a likely contributor to inflationary pressure.

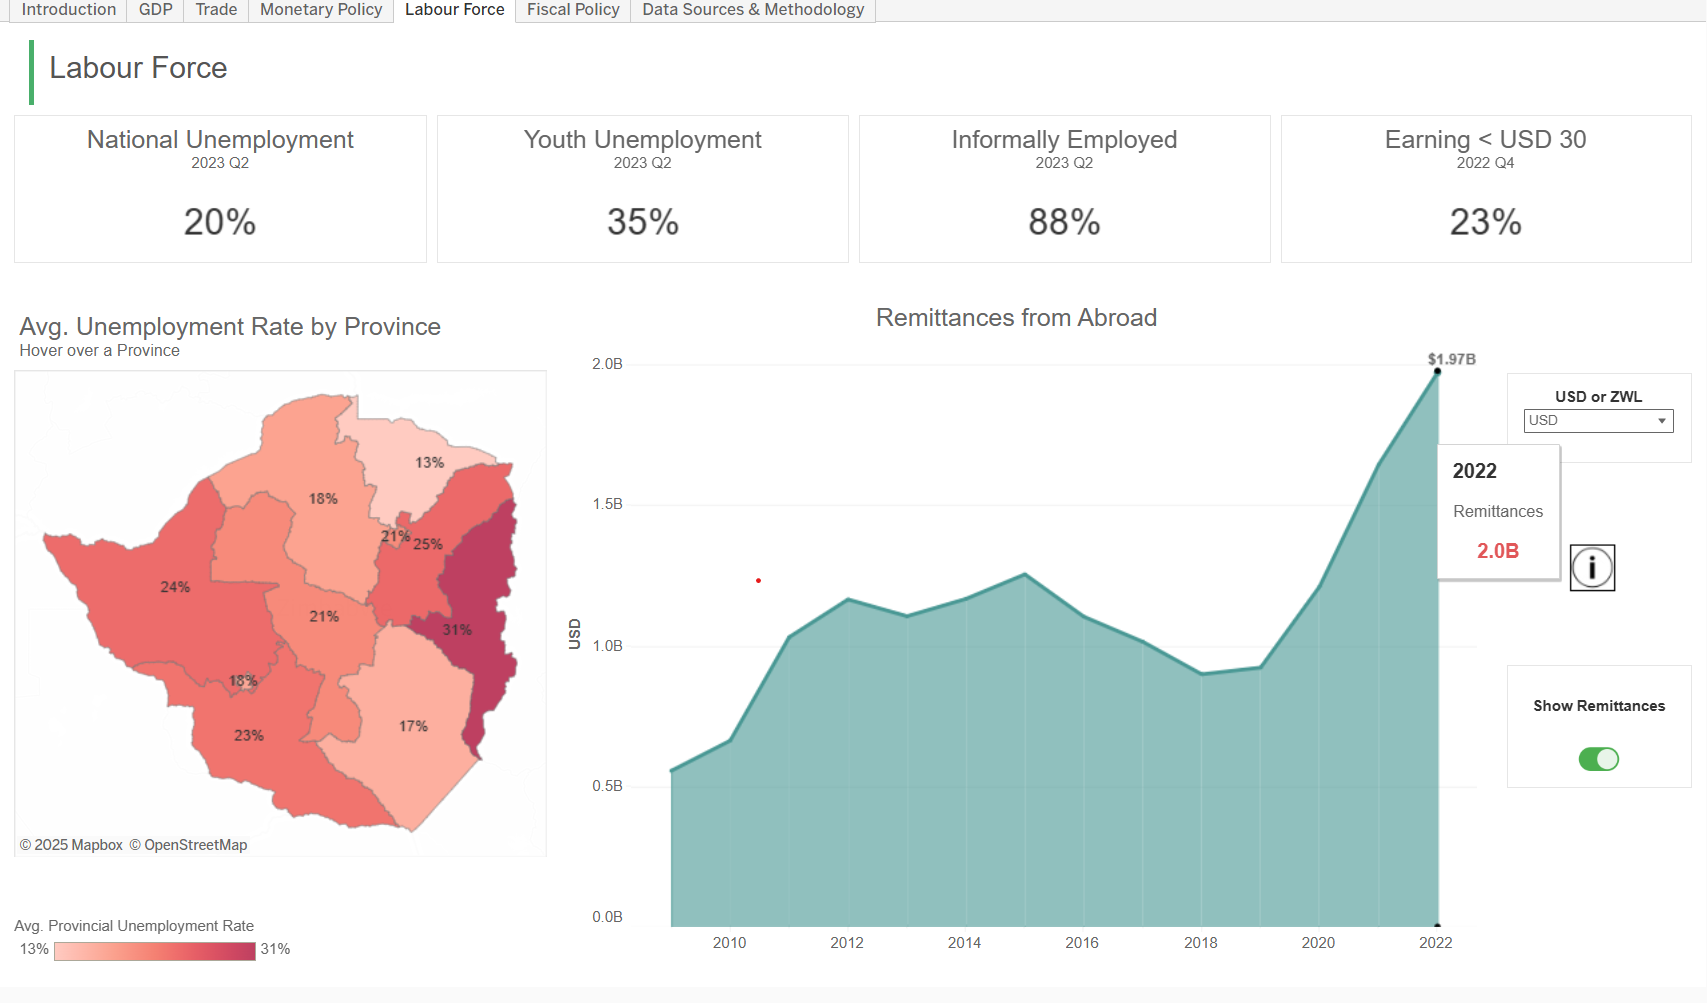
Labour Market Conditions

Labour force data revealed several structural challenges. In the second quarter of 2023, national unemployment stood at 20%, with youth unemployment reaching 35%. ZIMSTAT also reported that 88% of the labour force was informally employed—highlighting the dominance of informal work in Zimbabwe’s economy. In the fourth quarter of 2022, 23% of workers were earning less than $30 USD per month.

Remittances

Remittances from abroad played a critical role in supporting Zimbabwean households. From 2018 to 2022, total remittance inflows grew from $0.9 billion to $1.97 billion USD, showing just how vital the diaspora has become in stabilising incomes.

Fiscal Policy and Debt

On the fiscal side, government spending and borrowing remained under pressure. By the end of 2021, Zimbabwe’s public debt-to-GDP ratio was 85%, indicating that the country owed debt equivalent to more than four-fifths of its entire annual economic output. While this figure includes both domestic and external debt, it raises concerns about fiscal sustainability—particularly in a context of slow growth, high inflation, and currency instability.