
Web Scraping – Upwork
Scraped thousands of Upwork jobs and used a weighted Excel script to rank listings by fit, based on skills, pay, age, and relevance — helping target the best opportunities faster.
A collection of projects in data visualisation, workflow automation, and web scraping.
|

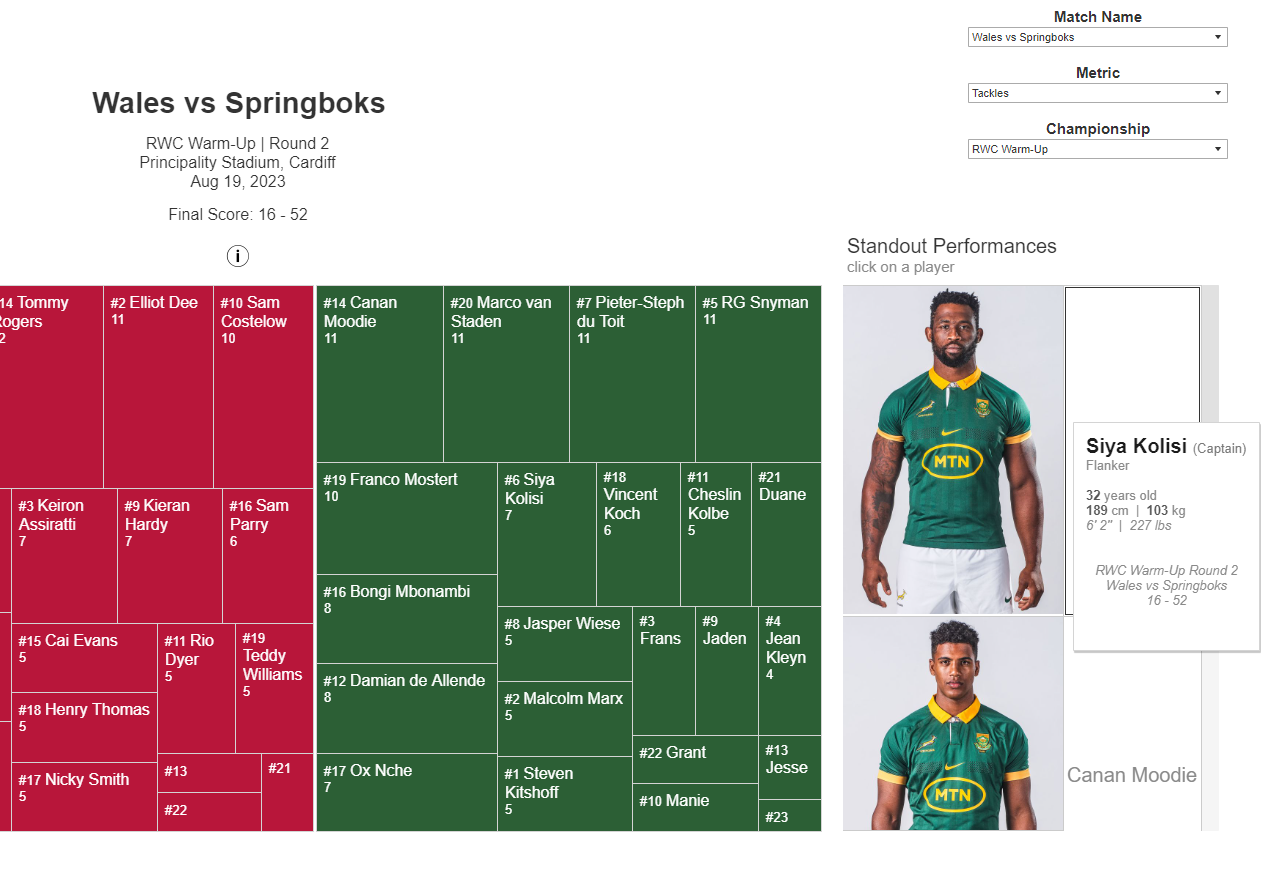
This project tracks every match played by the Springboks in their 2023 Rugby World Cup campaign, highlighting key stats, player contributions, and the immense pressure faced in the knockout rounds. It includes performance data from SA Rugby and features 71 highlight reels of individual players' game-defining moments.
This project explores Zimbabwe’s macroeconomic landscape in the lead-up to the 2023 elections, drawing on official data from the Zimbabwe National Statistics Agency, the Reserve Bank of Zimbabwe, and the Ministry of Finance & Economic Development. The dashboard highlights key aspects of the economy such as trade, GDP trends, labour conditions as well as fiscal and monetary policies.


This project analyses Zimbabwe’s 2018 presidential election data, sourced from an official dataset published by the Zimbabwe Electoral Commission (ZEC) after the election. The data shows polling results for all candidates at every polling station across the country. Using this comprehensive source alongside court records, the project highlights key irregularities and controversies like “Excelgate,” explores challenges in vote collation and political intimidation, and examines efforts to promote transparency ahead of the 2023 elections. The goal is to raise awareness and support fair electoral processes in Zimbabwe.
This project explores over 15 years of shooting incident data in New York City. It reveals where shootings happen, when they occur, who is involved, and how trends have changed over time.
Notably, during the COVID-19 lockdowns (2020–2021), NYC saw a surge in gun violence — averaging 4.24 shootings per day.

These projects are currently in development and will be shared soon.
Scraped thousands of Upwork jobs and used a weighted Excel script to rank listings by fit, based on skills, pay, age, and relevance — helping target the best opportunities faster.

Scraped car listings from Cars.co.za to build a regression model that assessed whether a vehicle was overpriced, undervalued, or fairly priced.
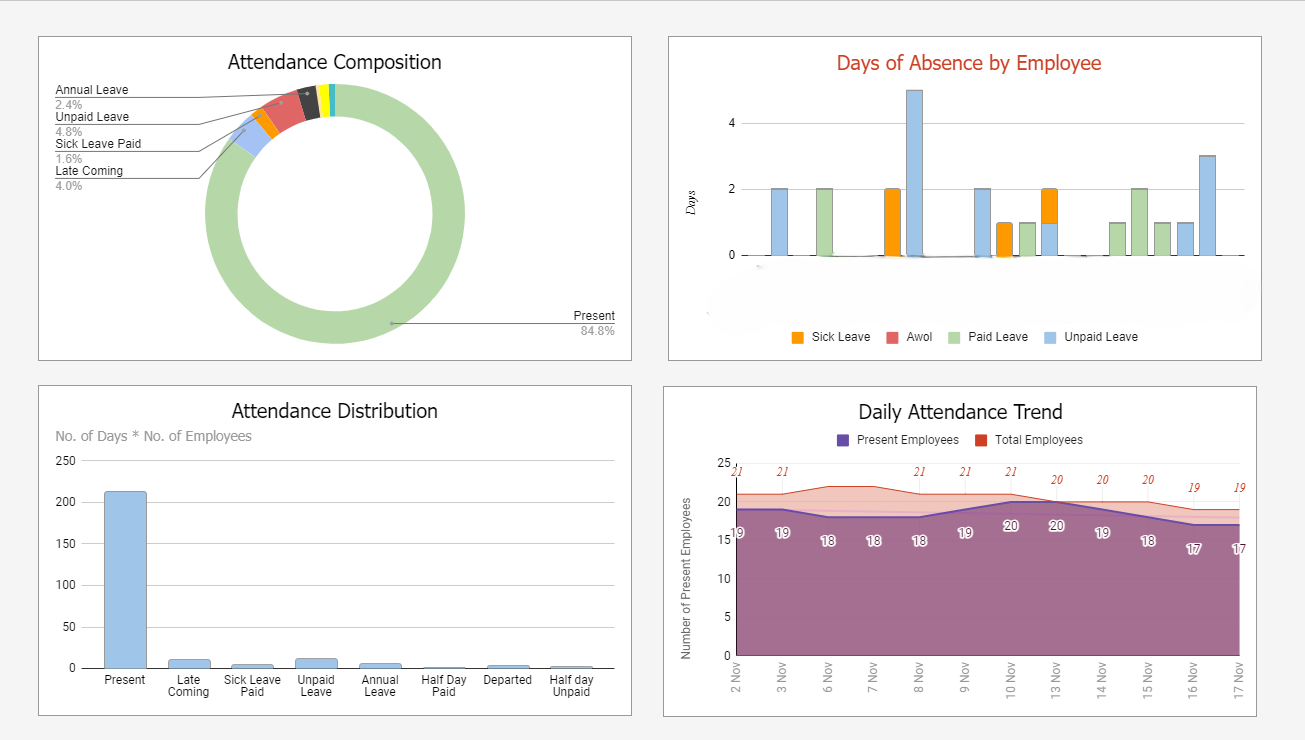
Built a Google Sheets dashboard to give managers clear visibility into staff attendance — showing who was present, who was absent, and the reasons why.

Visualised Chicago shooting incidents in Tableau, overlaying neighbourhood and gang territory shapefiles to explore geographic patterns in gun violence.
Mapped SAPS crime stats by police station using shapefiles at both station and provincial level to reveal national trends and crime hotspots across South Africa.
Automate workflows. Understand data. Drive outcomes.
Streamline repetitive tasks and business processes with custom automation solutions that increase efficiency and reduce human error.
Transform raw data into clear, actionable insights using advanced analytics and compelling visualisations that support strategic decision-making.
Cleanse, integrate, and restructure complex datasets to ensure accuracy, consistency, and usability across business systems and workflows.
Automate extraction of structured data from diverse web sources to empower research, market intelligence, and competitive analysis.
Develop automated interfaces and bots that interact with software systems to perform tasks faster and more reliably than manual operations.
Leverage data-driven strategies and reporting frameworks to monitor key metrics and drive informed business growth and performance.
Enhance spreadsheet functionality with custom formulas, macros, and scripts to automate calculations, reporting, and data workflows.
Design scalable, secure, and integrated system architectures tailored to meet complex business needs and technology landscapes.
Create automated reporting pipelines that deliver timely, accurate insights, reducing manual workload and accelerating decision cycles.
Implement automated compliance checks and monitoring to ensure adherence to regulatory standards and internal policies.
Build robust, scalable pipelines to automate data collection, cleansing, transformation, and storage — ensuring reliable, real-time access to high-quality data for analytics and operational needs.
What problem are you trying to solve?
Poor reporting? Repetitive tasks? Messy data? Let me know, and I’ll show you what better looks like.