NYC Shooting Incidents Dashboard
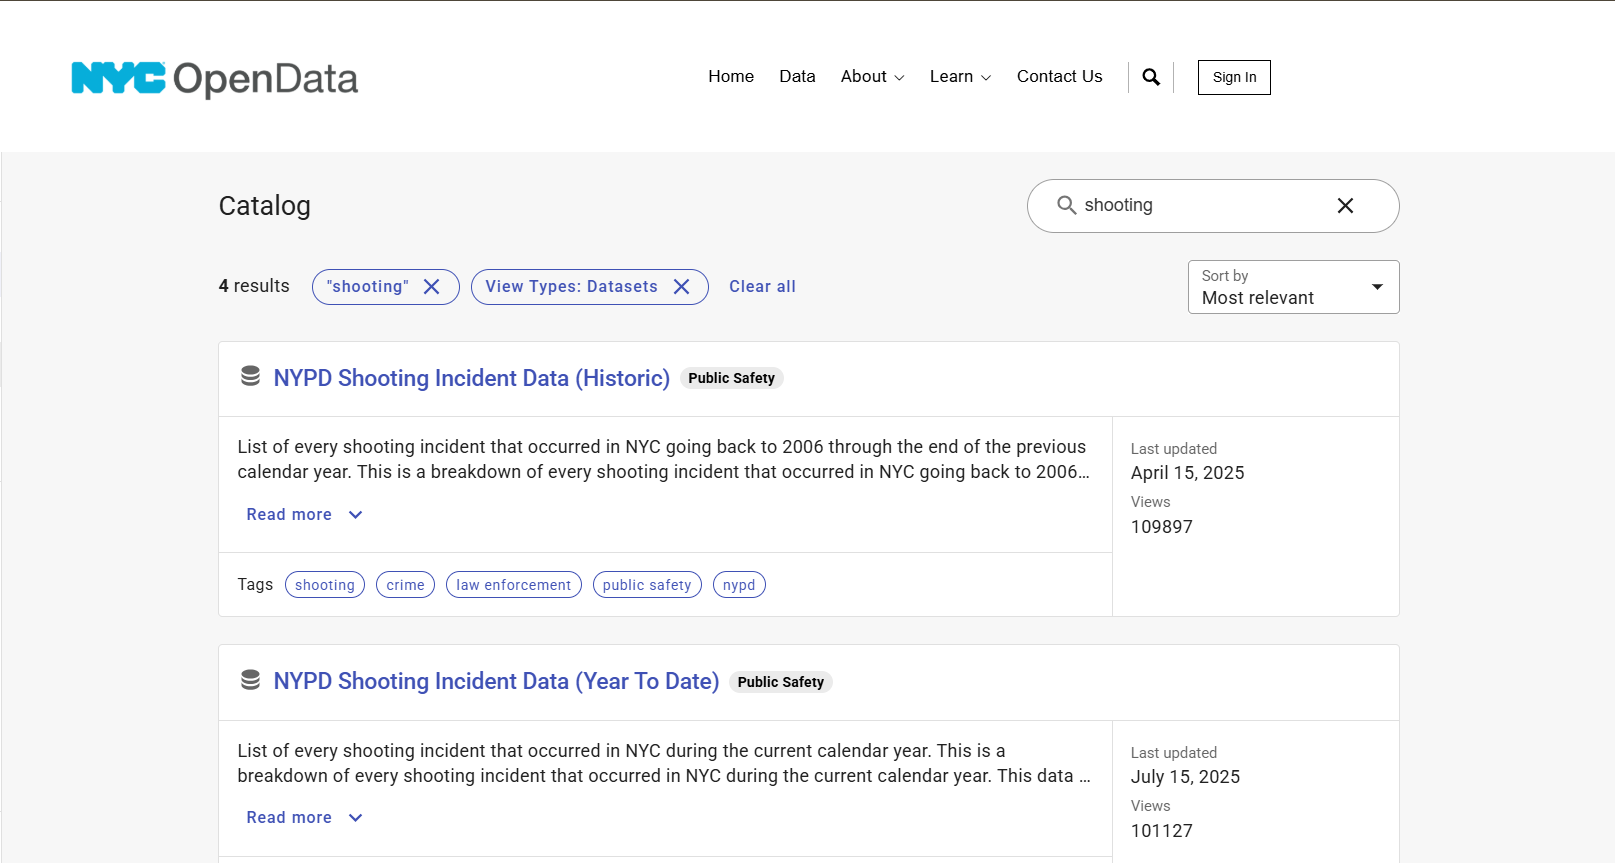
This project analyses shooting incidents in New York City, using rich data sourced from the NYC Open Data Platform.
I undertook this project early in my career as a data analyst to gain hands-on experience working with real-world data. Crime data intrigued me because of its complexity and social importance, and New York City’s open data portal provided an excellent, rich dataset to explore. Visualising this data using Tableau helped me understand the patterns of shootings across the city and sharpen my skills with the tool. It remains one of my most formative and rewarding projects.
Project Highlights
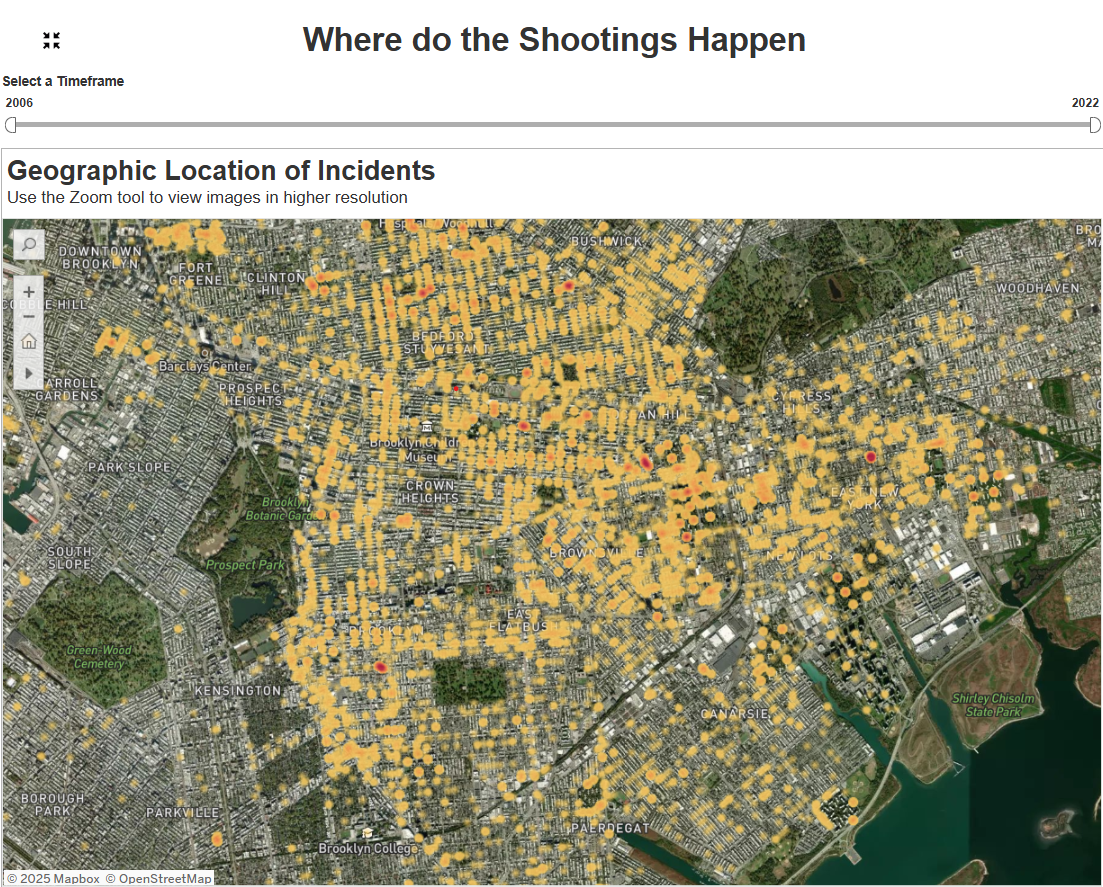
- Interactive data on where and when shootings occur, as well as visualising shooting rates over time
- Insights into victim and perpetrator demographics
- Mapping clusters and hotspots of shooting incidents
- Dynamic dashboard enabling user-driven exploration
Access the Dashboard
Explore the full dataset and interactive visualisations using the official Tableau dashboard linked below.